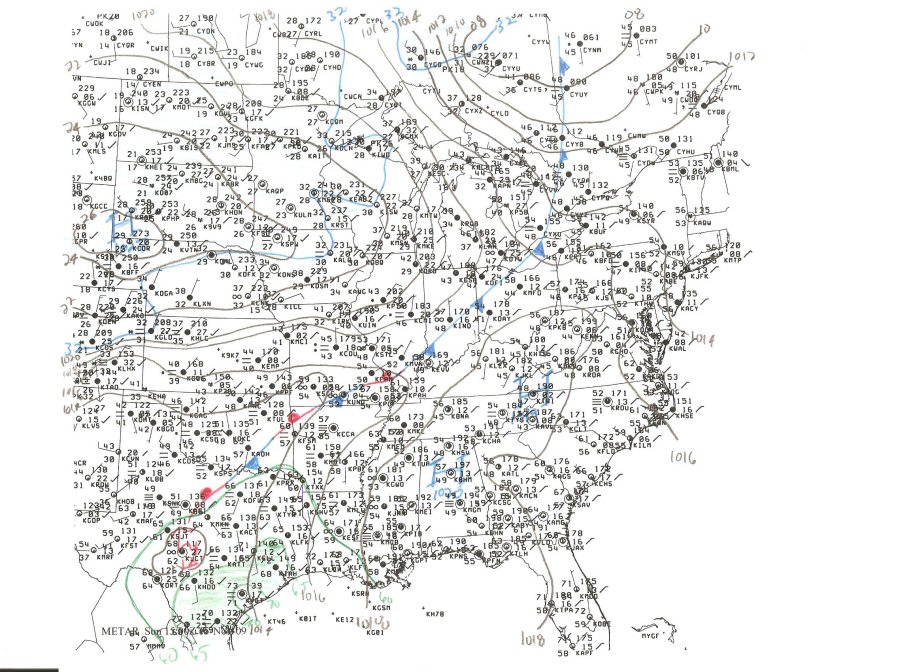
Surface Analysis:
Mean Sea Level Pressure
Contours: At 2mb intervals using 1000mb as the baseline.
Pressure centers and
central values: High - blue H
/ Low - red
L
Isotherms: Every 2
degrees Fahrenheit, using fine solid red lines.
Isodrosotherms: Every
5 degrees Fahrenheit for values greater than 60 F, using fine solid
green lines.
Frontal boundaries:
Warm
Front
(RED
line of semi-circles pointing
in the direction of travel),
Cold
Front (BLUE
line of triangle-shaped pips pointing in the direction of travel),
Occluded
Front (PURPLE
line with alternating
half-circles and triangles pointing in direction of travel),
Stationary
Front (alternating RED
half-circles and BLUE
spikes pointing in opposite directions),
Dry
Line (ORANGE
line with scallops facing
into the moist sector) and
Surface
Trough (BLACK
dashed line indicating the wind shift).
Example
of a Surface
Analysis.
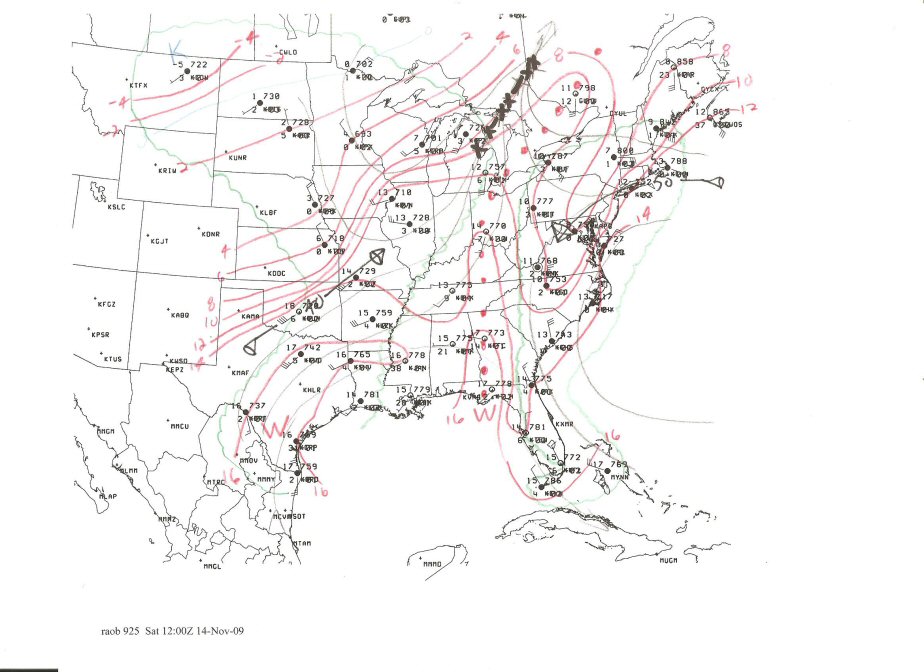
925mb Analysis: Key parameters are analyzed in BLACK
unless noted otherwise below.
Streamline in pencil.
Depict axes of confluent winds using black (-XX-)
lines.
Axes of maximum wind
flow: 25 kts, using broad solid black arrows with all speed maxima
labeled.
Isotherms: Every 2
Celsius degrees, using fine solid red lines with the 0C isotherm in
blue.
Thermal ridges: Red
dots (
. . . . . ).
Warm and cold
pockets: Warm - red W/
Cold - Blue K
Isodrosotherms: Every
2 Celsius degrees for values of 10C, using fine solid green lines.
Axes of maximum dew
points: Broad solid green wavy lines for moisture advection, and broad
dashed green wavy line against the flow.
Moisture areas
(outside of 6C isodrotherm): For areas of T-Td of 6C, enclose in a fine
green scalloped lines.
Circulation centers:
Cyclones - black C/ Anticyclones black A
Dry Air Intrusion:
Dry air (10C degrees drier) intruding into a significant moisture field
(dewpoint depressions < 6C), using fine black (-
- -) lines. Do not depict this
immediately upwind of a moisture axis.
Example
of a 925mb Analysis.
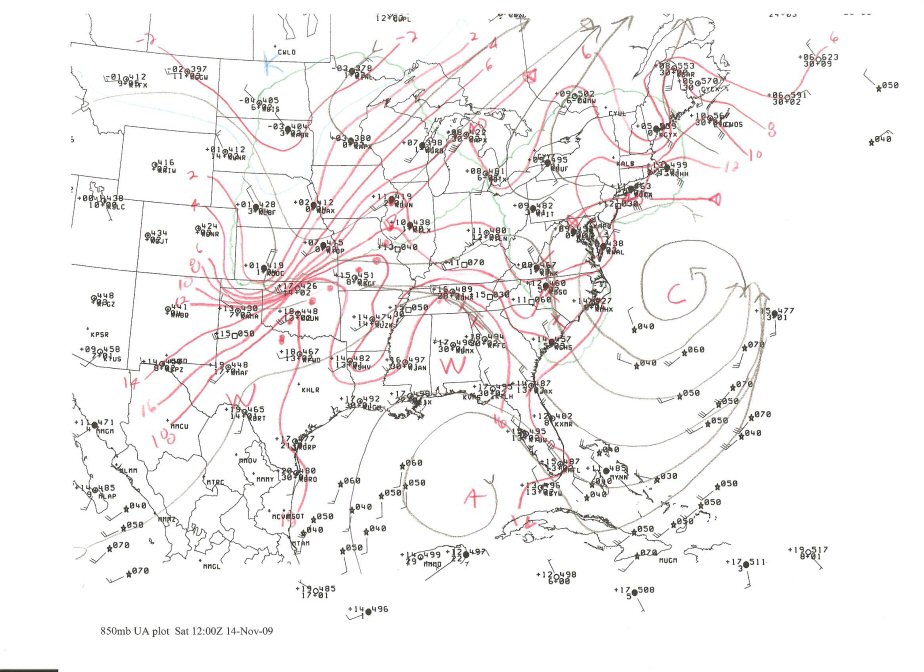
850mb Analysis: Key parameters
are analyzed in RED
unless noted otherwise below.
Streamline in pencil.
Depict axes of confluent winds using red (-XX-)
lines.
Axes of maximum wind
flow: 25 kts, using broad solid red arrows with all speed maxima
labeled.
Isotherms: Every 2
Celsius degrees, using fine solid red lines with the 0C isotherm in
blue.
Thermal ridges: Red
dots (
. . . . . ).
Warm and cold
pockets: Warm - red W/
Cold - Blue K
Isodrosotherms: Every
2 Celsius degrees for values of 6C, using fine solid green lines.
Axes of maximum dew
points: Broad solid green wavy lines for moisture advection, and broad
dashed green wavy line against the flow.
Moisture areas
(outside of 6C isodrotherm): For areas of T-Td of 6C, enclose in a fine
green scalloped lines.
Circulation centers:
Cyclones - red C/
Anticyclones red A
Dry Air Intrusion:
Dry air (10C degrees drier) intruding into a significant moisture field
(dewpoint depressions < 6C), using fine red (-
- -)
lines. Do not depict this immediately upwind of a moisture axis.
Example
of an 850mb Analysis.
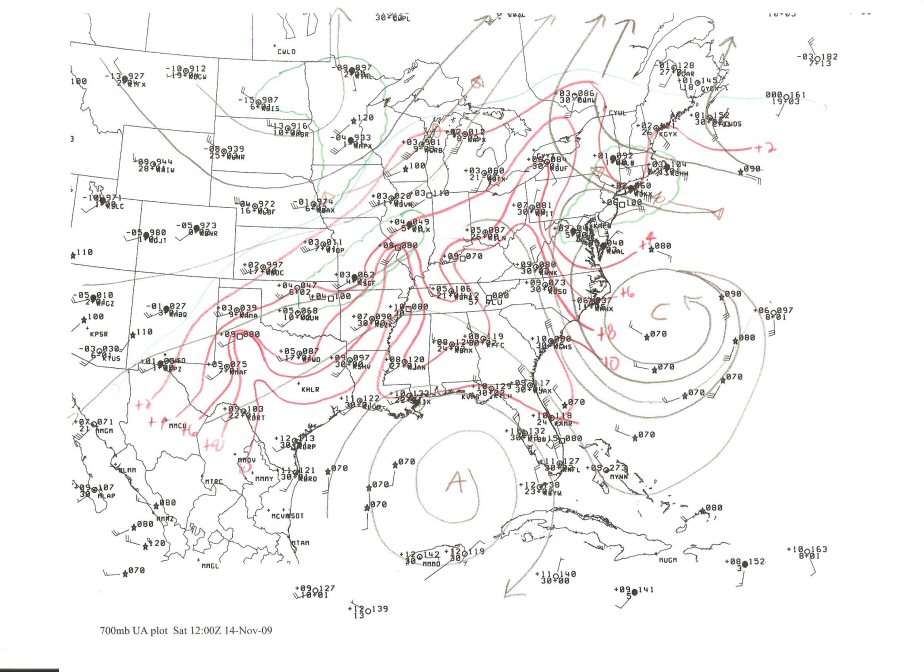
700mb Analysis: Key parameters
in BROWN.
Streamlines in
pencil.
Axes of maximum wind
flow: 30 kts, using broad solid brown arrows with all speed maxima
labeled.
Isotherms: Every 2
Celsius degrees, 6C, using fine solid red lines with the 0C isotherm in
blue.
Moisture areas: For
areas with a T-Td of 6C, enclose in a fine green scalloped lines.
Circulation centers:
Cyclones - brown C/
Anticyclones - brown A
Dry Air Intrusion:
Drawn using broad brown dashed (- - - - -)
line.
Example
of a 700mb Analysis.
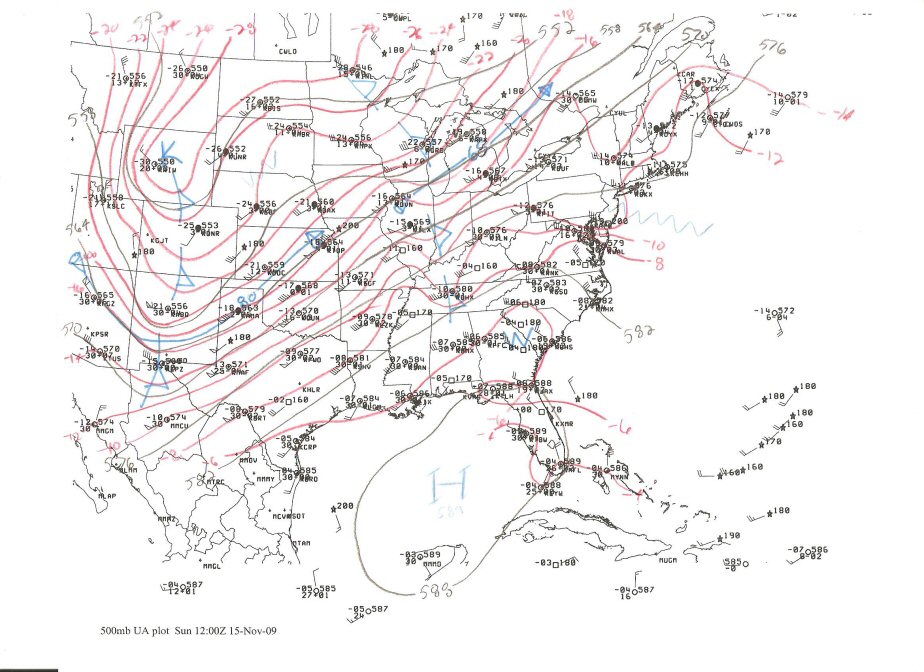
500mb Analysis: Key parameters
are outlined in BLUE.
Contour Analysis: At
60m intervals, using 5400m (540dam) as the baseline, in fine solid
black lines.
Axes of maximum wind
flow: 30 kts ( 40 kts in winter), using broad solid blue arrows with
all speed maxima labeled.
Isotherms: Every 2
Celsius degrees, using fine solid red lines.
Moisture areas: For
areas with a T-Td of 6C, enclose in a fine green scalloped lines.
Thermal (cold)
troughs: Depicted as a broken blue cold front ( ).
Warm and cold
pockets: Warm - blue W/
Cold - Blue K
Height centers and
central values: High - blue H
/ Low - blue L
12 hours height
falls: Every 30m (3dam), using fine blue lines with rectangular barbs
pointing toward the height fall center. If the center exceeds 180m
(18dam), draw height falls isopleths every 60m (6dam). Label the center
with an X and the maximum value.
Difluent regions or
speed divergence: Broad blue zigzag (WWWWW)
lines.
Areas of speed
divergence: Broad blue wavy lines (speed divergence 30 kts/90NM)
Example
of a 500mb Analysis.
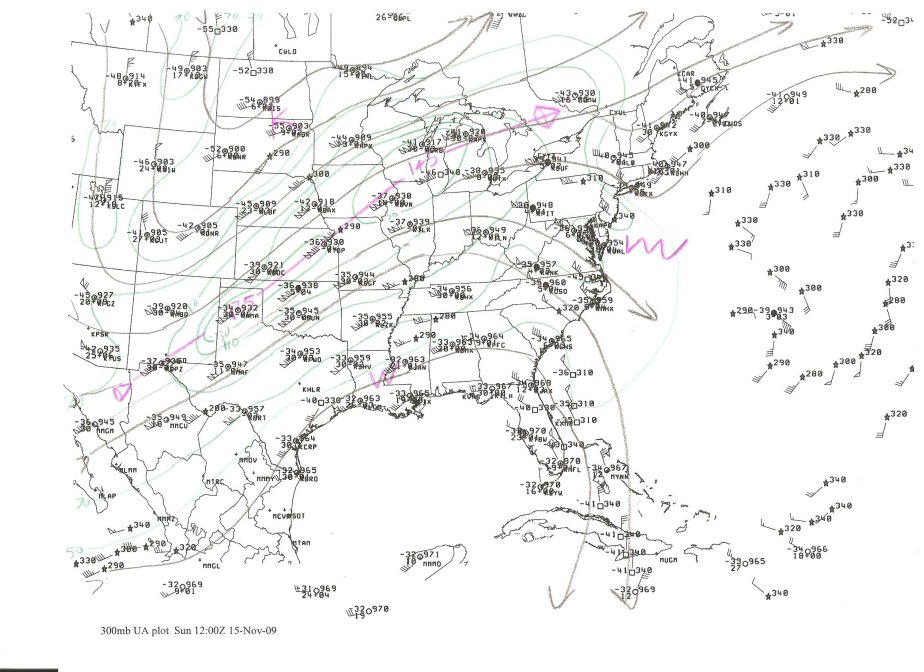
300mb and 200mb Analysis: Key
parameters are analyzed in PURPLE.
Streamline in pencil.
Isotachs in green
every 20 knots, starting with 50 knots.
Axes of maximum wind
flow: 50 kts, using broad solid purple arrows with all speed maxima
labeled.
Difluent regions:
Broad purple zigzag (WWWWW)
lines.
Areas of speed
divergence: Broad purple wavy lines (speed divergence 30 kts/90NM)
Height falls in
purple (300mb only) using same procedures as listed under 500mb height
falls above.
Warm and cold
pockets: Warm - purple W/
Cold - purple K
Example
of a 300mb Analysis.